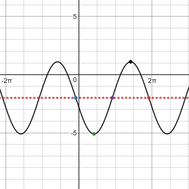
Steps in Graphing a Transformation of a Sine Function
1) Do you know the shape of the final graph? (Is it a reflection of sine or not?)
2) Do you know the length of the period? (2pi/b=period)
3) Do you know the phase shift? (-c/b = phase shift)
4) Can you find five points that lie on the intended graph of the transformation?
(three points on midline and two points at the extreme y values of the function)
5) Do you know where the midline is? (y = d)
6) Do you know what the sign of a tells you about the location of the points of the graph of the transformation? (Is a is negative? Where does the maximum and minimum live on the graph?)
Click on image to go to Desmos graph program.
|
